Download and customize this and hundreds of business presentation templates for free


Voila! You can now download this presentation
DownloadWhat is a project plan? Below, we'll explain how to write a project plan, how to use the top project plan tools to complete your project on time, how to customize our Project Plan to get you started, and if you read to the end, you'll learn some project plan examples of how the project planners at the Hoover Dam completed production on the world's biggest masonry project since the great pyramids a whole two years[/italic] ahead of schedule.
Questions and answers
To write your project plan, five key questions need to be answered. To answer these critical questions, we've collected a series of top tools from our project plan template, like a PERT Chart, Critical path diagram, Work Breakdown Chart, Project Risk Analysis, and Issue Tracker, which are just some of the many slides that are available in our Project Plan template.
Questions and answers
Voila! You can now download this presentation
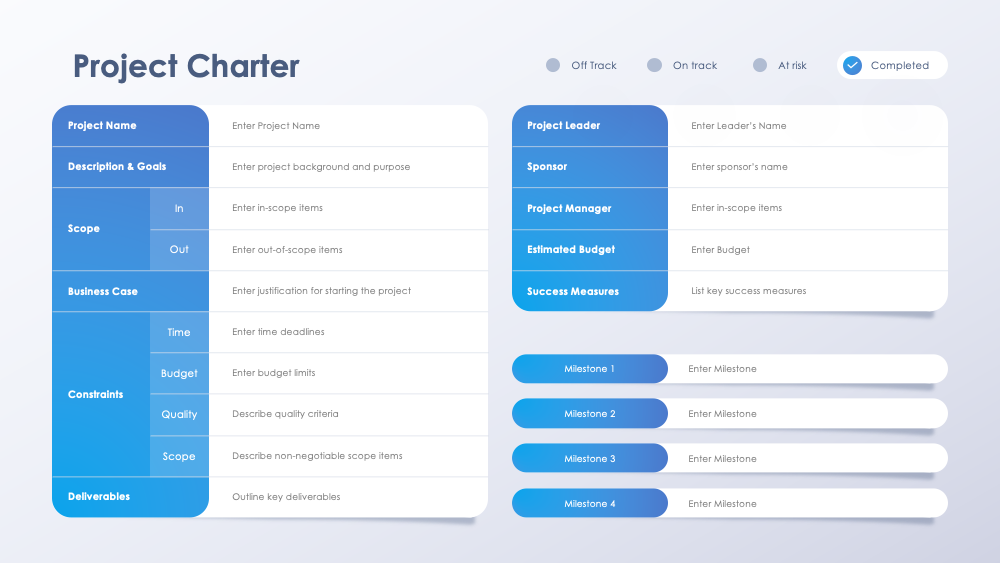
DownloadThe first step in any project plan is to ask, "What is the project scope?" Project scope is a detailed account of all the project's elements, like related activities, resources, timelines, and deliverables. Without a thorough scope, you could find yourself adding activities to a project, that then extends the timeline, which puts you behind schedule, and then all of a sudden you understand why government projects take so long! Except not the Hoover Dam - which we'll cover at the end of this article.
Questions and answers
However, even the tasks you do plan for can hold your project back. That's because many tasks are dependent on one another - even those that don't happen in order. A PERT Chart is a visualization that tracks these various tasks in a freeform flowchart to show their dependency on one another with arrows. Instead of a GANTT Chart that flows left to right in a timeline format, tasks might not be solely sequentially dependent, as you might have to go back and repeat work on one task that changes a future task and vice versa. The arrows also dictate whether something is directly connected versus dependent without resources. Dependent without resources refers to when the tasks aren't connected to each other but still relate. (Slide 5)[/italic]
Questions and answers
For instance, think of how a product launch is directly dependent on a feature test but is indirectly related to a product website. You still need a website to sell your product, but you don't need a website to make your product - unless your product is a website. A great example of this is actually what happened when the Six companies company started the Hoover dam project. They not only had to build a dam, but they had to build an entire town to house all the workers to build the dam. More on that at the end of the article!
The timeline to complete a project is the second most vital question to answer. Timelines are vital to a project's success. In order to meet that timeline, you need to forge a critical path. Critical paths show the dependency and connection between a project's most important tasks. The template we created has multiple slides to help structure your critical path, either with a flowchart (Slide 6)[/italic], with a table (Slide 7)[/italic], or with a table and[/italic] Gantt Chart.
Questions and answers
This visualization tabularizes your critical path across the tasks, responsible team member, start and finish date, duration of the task, and its current status. The GANTT Chart at the bottom divides these tasks into SPRINTS with the sub-tasks underneath. Because this Gantt chart correlates to critical path, the arrows can be used to show the dependencies between these tasks. This can be used to determine which (if any) single decision can make or break another one. (Slide 8)[/italic]
The next task in a project plan is to determine what resources are available. Work breakdown structure tackles resource allocation, time management, and budgeting all in one so resources match up to the project scope you just created.
This slide has a work breakdown visualized like an org chart and shows the main tasks and subtasks to accomplish the goal. While this visualization has each budget listed under its task name, this could also be edited to track the role of the team member responsible as well. To track each task's progress toward completion, the middle of each task shows percentage-based status bars. For instance, if your task was to learn how to make a project plan, congratulations, you're 50% of the way done! (Slide 11)[/italic]
Questions and answers
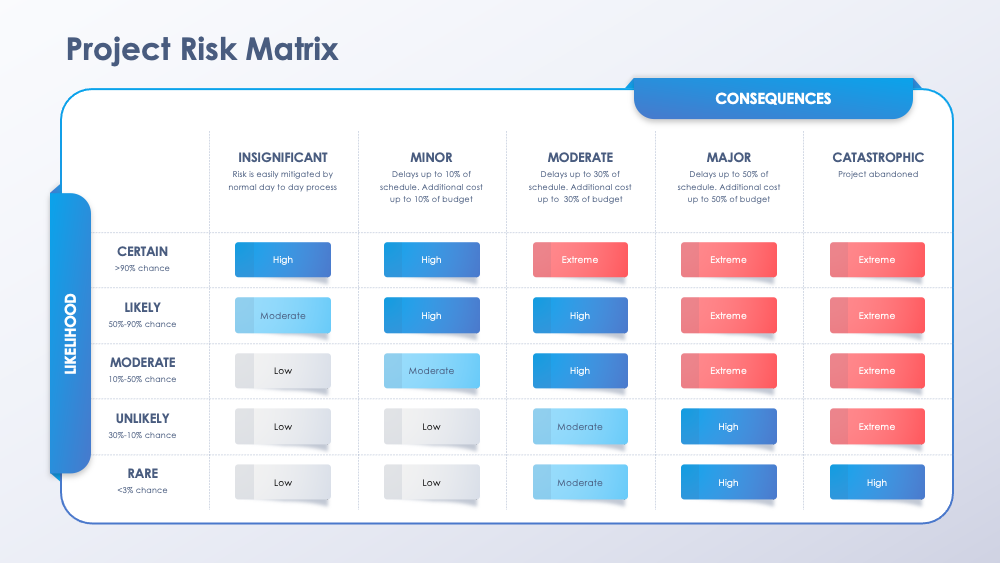
This risk analysis table breaks down the risks associated with your project and then ranks them based on impact and probability of occurrence. Multiply these together to calculate a risk value, or an estimate of the cost of the risk. (Slide 18)[/italic]
Inform your risk analysis with this risk matrix to track risk likelihood against level of consequence. If a risk has an catastrophic level of impact and certainty, it needs to be managed carefully. (Slide 19)[/italic]
Here's one last tool to help with risk management - an issue tracker, which is helpful to assess if your project is on target according to what you thought at the start or if need to push your timeline back. This pairs well with the PERT chart, since if dependent tasks become issues, it could be a red flag to push back your project timeline. This is helpful for complex, mid to large scale projects - like, say, the Hoover Dam! (Slide 16)[/italic]
Questions and answers
So how did the Hoover Dam end up two years ahead of schedule? While the Dam was the largest government project in history at the time, in order to win the bid, the Six Companies group had to put up the first $5 million themselves. Then, they faced fines for every day they went behind schedule. This incentive mandated that they find ways to stay on schedule - great motivation for any project plan.
One of the ways the project saved time was by not waiting for the town to be built before they started work on the dam. *If this was visualized on a PERT Chart, the project planners could see that the two tasks were dependent without resources, as noted by the blue arrows in the above visualization. Since one required concrete and steel and the other required lumber and food. Because they started in 1931, two years into the Great Depression, they had access to a wealth of workers looking for a job. So workers started six months ahead of schedule and lived in a "rag town" while they waited for utilities to be piped in from 500 miles away.
In order to stay on track, the project planners also had to get around another critical issue: the dam required so much concrete that if they poured it all in one block, it would take over 125 years to cool. This was the critical path needed to overcome to finish on time. They would have to break up this large task across multiple, smaller tasks in order to reach their target end date. The solution: pour the concrete into five-foot blocks, then use pipes to pump cold water through each block to cool it enough to pour the next block on top of it. While 80% of projects don't set baseline schedules, this extreme attention to timeline made all the difference.
If the tools to make a solid project plan are in your way, you need this presentation. Download the Project Plan for more slides on the Impact and Effort matrix, Project Portfolio, Status Reports, Stakeholder Registers, Task Prioritization, and many more to save time and hours of work.
Voila! You can now download this presentation
Download