


Voila! You can now download this presentation
DownloadEffective decision making is impossible without Key Performance Indicators (KPIs). One important thing to know about KPIs' "behavior" is that they constantly overlap and influence each other. Lay out your lead performance indicators alongside each other with our KPI Dashboards (Part 1) presentation and instantly analyze and communicate to your team the goals that are met regularly and those that need reevaluation.
Voila! You can now download this presentation
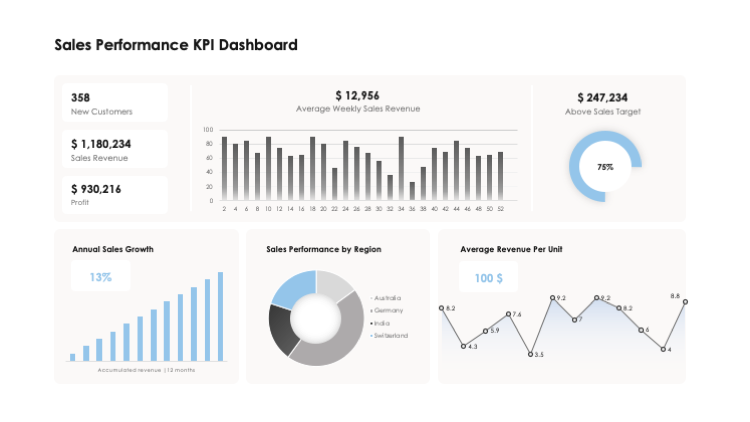
DownloadSetting up a KPI dashboard for financial metrics is an efficient way to keep track of an organization's business performance. Use this slide to reflect the results of revenue and profits measurements.
With this slide, communicate your venture's sales KPIs and results. Essential KPIs to include here: monthly sales growth, sales opportunities created, lead conversion rate and sales targets.
Measure and present your Project Status Report and keep your team and executives informed, using this slide. Include project timelines, budget, quality and effectiveness as your project management KPIs.
With this slide, share your customer-centric KPIs. These include Customer Satisfaction Score, Net Promoter Score (Part 2), First Response Time, Customer Retention Rate and Service + Quality.
A well-organized KPI dashboard ties all your performance indicators together in one place, so you can easily compare and analyze them. Because these indicators are usually divided into high-level and low-level KPIs, laying them out on a single dashboard helps to monitor the process of smaller goals flowing into bigger ones.
The experts from intelligent business performance firm, Bernard Marr & Co., list the following steps as essential when working on a KPI dashboard:
According to the report conducted by The KPI Institute:
Voila! You can now download this presentation
Download