KPI और प्रदर्शन मापदंड Presentation preview
शीर्षक Slide preview
कैश-टू-कैश साइकिल Slide preview
आपूर्ति श्रृंखला लागत बनाम बिक्री Slide preview
आपूर्ति श्रृंखला लागतें Slide preview
आदेश (बैकऑर्डर) Slide preview
आपूर्ति गुणवत्ता सांख्यिकी Slide preview
आय और व्यय Slide preview
वित्तीय प्रदर्शन Slide preview
कैश फ्लो डैशबोर्ड Slide preview
सारांश डैशबोर्ड Slide preview
त्रैमासिक सारांश Slide preview
प्रोजेक्ट विकास - कार्यभार Slide preview
कार्य डैशबोर्ड Slide preview
ट्रायज्ड कार्य Slide preview
सरल प्रोजेक्ट प्रबंधक Slide preview
प्रोजेक्ट डैशबोर्ड Slide preview
सामाजिक मीडिया विपणन Slide preview
विज्ञापन बजट Slide preview
विज्ञापन डैशबोर्ड Slide preview
विज्ञापन माध्यम Slide preview
ब्रांड परिचय Slide preview
ब्रांड प्राथमिकता Slide preview
प्रोजेक्ट मार्केटिंग Slide preview
संतुलित स्कोरकार्ड Slide preview
ऑपरेशनल प्रदर्शन मापदंड Slide preview
कर्मचारी प्रदर्शन अंक Slide preview
प्रदर्शन स्कोरकार्ड Slide preview
chevron_right
chevron_left
download Download this presentation

Get 10 out of 30 slides

Powerpoint Keynote
View all formats chevron_right

Download and customize this and hundreds of business presentation templates for free

Start for free ⬇️

Voila! You can now download this presentation

Download

Explainer

Preview

View all chevron_right

सारांश

क्या आपकी टीम आपके सबसे महत्वपूर्ण व्यावसायिक उद्देश्यों को पूरा करने में संघर्ष करती है? KPI और प्रदर्शन मापदंड उच्चाधिकारियों के लिए महत्वपूर्ण हैं क्योंकि वे संगठनात्मक जिम्मेदारी बनाते हैं जो सबसे अधिक आवश्यक हैं महत्वपूर्ण लक्ष्यों को प्राप्त करने के लिए। KPI और प्रदर्शन मापदंड प्रस्तुति टेम्पलेट डाउनलोड करें ताकि आपकी टीम के सदस्यों को सिंक करें, व्यक्तिगत सदस्यों में आत्मनिर्भरता डालें, और निर्णय लेते समय महत्वपूर्ण लक्ष्यों को ध्यान में रखें। टेम्पलेट में आपूर्ति श्रृंखला डैशबोर्ड, प्रोजेक्ट प्रबंधन डैशबोर्ड, विपणन डैशबोर्ड, और कर्मचारी प्रदर्शन डैशबोर्ड, सहित वित्तीय प्रदर्शन, विज्ञापन, प्रोजेक्ट विपणन, संचालन प्रदर्शन मापदंड, संतुलन स्कोरकार्ड और प्रोजेक्ट प्राथमिकता त्रियाज, और अन्य कई डैशबोर्ड शामिल हैं।

stars icon
Questions and answers
info icon

Yes, KPIs and other performance metrics can be compared in terms of their effectiveness. KPIs, or Key Performance Indicators, are specific and often quantifiable measures that an organization uses to track its progress towards a defined goal. Other performance metrics, while also used to track progress, may not be as closely tied to key business objectives. KPIs tend to be more strategic, focusing on long-term performance and overall organizational success, while other performance metrics may be more operational, focusing on short-term performance in specific areas. However, both are crucial for a comprehensive understanding of an organization's performance.

The KPI and Performance Metrics presentation template can help in keeping critical goals top of mind by creating a visual representation of key performance indicators and metrics. This allows team members to easily understand and track progress towards these goals. The template also fosters organizational accountability, as it clearly outlines what is needed to reach these critical goals. Furthermore, it can instill self-reliance in individual team members, as they can see how their individual contributions align with and impact the overall objectives.

View all questions
stars icon Ask follow up

उपकरण की विशेषताएं

आपूर्ति श्रृंखला डैशबोर्ड

जब उच्चाधिकारी अपनी आपूर्ति श्रृंखला का ट्रैक करते हैं, तो वे अपने ज्ञान को बढ़ाते हैं कि कैसे परिवर्तन लाभ मार्जिन पर प्रभाव डालते हैं, जो सबसे महत्वपूर्ण KPIs में से एक है। उदाहरण के लिए, यदि लाभ मार्जिन घटना शुरू हो जाता है लेकिन आपूर्ति लागत बढ़ जाती है, तो यह एक प्रमुख लाल झंडा हो सकता है।

इस आपूर्ति श्रृंखला डैशबोर्ड में, उच्चाधिकारी आपूर्ति श्रृंखला लागत, आपूर्ति श्रृंखला लागत बनाम बिक्री, इन्वेंटरी तक बिक्री का अनुपात, और इन्वेंटरी की वहन करने की लागत को माप सकते हैं। यह आपूर्ति श्रृंखला लागत दृश्यीकरण आपको एक नजर में मदद करता है जो लागत सबसे बड़ी है, और इसे कंपनी या टीम की बिक्री के खिलाफ मापा जा सकता है और उद्योग के औसत के साथ तुलना की जा सकती है।चूंकि इन्वेंटरी अक्सर किसी कंपनी का सबसे बड़ा खर्च होता है, इसलिए इन्वेंटरी से बिक्री के अनुपात और इन्वेंटरी की वहन की लागत को भी रेखा और बार ग्राफ के साथ मापा जा सकता है।

stars icon Ask follow up

एक याद दिलाने के लिए, ये डैशबोर्ड सभी Excel शीट्स से जुड़ते हैं जहां निर्वाहक अपना डाटा डालते हैं। इस टेम्पलेट में दिए गए उदाहरण में तीन साल का डाटा है, लेकिन निर्वाहक इस शीट को संपादित करके इस रेंज को कम या बढ़ा सकते हैं। (स्लाइड 5)

आपूर्ति श्रृंखला लागतें

वैश्विक वित्तीय प्रदर्शन

एक अलग दृश्यरचना KPIs को वैश्विक वित्तीय प्रदर्शन, आदेशों के साथ उनकी स्थिति और तिथि, इन्वेंटरी का आकार, दैनिक आदेशों की मात्रा और मासिक आपूर्ति श्रृंखला की लागत के अच्छ्रेत्र में भी शामिल होती है। (स्लाइड 6)

मत भूलिए, आप इन डैशबोर्ड्स के शीर्षकों को बदल सकते हैं, जैसा कि आप चाहते हैं कि उन्हें मापा जाए, क्योंकि वे सभी पूरी तरह से अनुकूलनीय हैं

आदेश (बैकऑर्डर)

प्रोजेक्ट प्रबंधन डैशबोर्ड

प्रोजेक्ट प्रबंधकों और कार्यकारी दलों के लिए, KPIs एक प्रगति रिपोर्ट की तरह होते हैं जिसका उपयोग सफलता को मापने के लिए किया जाता है। हालांकि, KPIs केवल पिछले प्रदर्शन समीक्षाओं के लिए नहीं होते। सर्वश्रेष्ठ PMs KPIs का उपयोग अपने लक्ष्यों की प्राप्ति की प्रगति को वास्तविक समय में मापने के लिए करते हैं।

stars icon
Questions and answers
info icon

KPIs and Performance Metrics can be effectively used to track ROI in social ad spends by setting clear objectives and goals for your social media campaigns. These could include increasing brand awareness, driving traffic to your website, or generating new leads. Once these goals are set, you can identify the KPIs that align with these objectives. For example, if your goal is to increase brand awareness, your KPIs could include reach, impressions, and engagement rate. If your goal is to drive traffic to your website, your KPIs could include click-through rate and bounce rate. By tracking these KPIs, you can measure the effectiveness of your social media campaigns and calculate the ROI.

Common challenges in tracking marketing expenditures include lack of clear objectives, inadequate tools or systems for tracking, and difficulty in attributing results to specific marketing activities. These can be overcome by setting clear, measurable objectives for each marketing activity, investing in robust tracking tools or systems, and using attribution models to link results to specific activities.

View all questions
stars icon Ask follow up

इस प्रोजेक्ट प्रबंधन डैशबोर्ड का उपयोग सक्रिय प्रोजेक्ट्स को ट्रैक करने के लिए एक Gantt चार्ट और प्रोजेक्ट स्थिति स्लाइडर के साथ किया जा सकता है। एक Burndown चार्ट कार्यों की योजनाबद्ध समाप्ति की तुलना में वास्तविक समाप्ति को तुलना करता है।नीली रेखा योजनाबद्ध उत्पादकता है, या कार्यों की संख्या, जबकि हरी रेखा वास्तविक कार्यों की संख्या है। यदि योजना वास्तविक से अधिक होती है, तो टीम समय सारिणी से पीछे है, लेकिन यदि वास्तविक योजना से अधिक होती है, तो आप अच्छी स्थिति में हैं।

stars icon
Questions and answers
info icon

The key elements of a marketing dashboard that focuses on likes and engagement driven by social ad spending include tracking total likes and engagement across major social platforms over a given period of time, detailing ad spend across different ads, highlighting important financial metrics related to ad spending and return such as total budget, amount spent, revenue created, and ROI.

While I don't have specific case studies at hand, the effectiveness of using a marketing dashboard for tracking likes and engagement driven by social ad spending can be demonstrated through various metrics. A marketing dashboard provides a comprehensive view of performance metrics across different social media platforms. It allows businesses to track their ad spend and measure the return on investment. For instance, the dashboard can show the total budget, the amount spent, and the revenue created. By analyzing these metrics, businesses can adjust their strategies to optimize their ad spend and increase engagement. This can lead to a higher return on investment, as demonstrated by the 62% ROI in the provided content.

View all questions
stars icon Ask follow up

कार्यों की संख्या और कुल घंटों का बार चार्ट पीएम्स को यह समझने में मदद करता है कि कार्य उनकी उत्पादकता योजना से क्यों कम हो रहे हैं - शायद किसी विशेष कार्य के लिए पर्याप्त घंटे समर्पित नहीं हैं, उदाहरण के लिए। (स्लाइड 14)

कार्य डैशबोर्ड

विपणन डैशबोर्ड

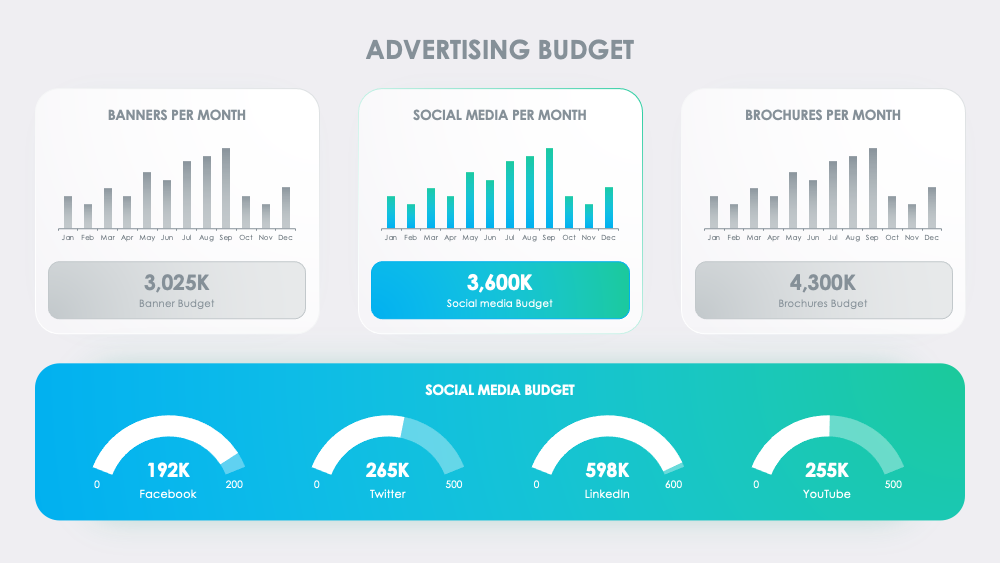
विपणन अक्सर कार्यकारी और कंपनियों के लिए एक प्रमुख विकास बोतलगर्द हो सकता है। एक विशाल खर्च के रूप में, यदि इसे ठीक से ट्रैक नहीं किया जाता है, तो यह हजारों या शायद लाखों डॉलर जला सकता है। यह विशेष रूप से सामाजिक विज्ञापन खर्च के लिए सच है, जहां आरओआई को ट्रैक करना महत्वपूर्ण होता है ताकि प्रतिलिपि और लक्ष्यबद्धता को समायोजित किया जा सके।

stars icon Ask follow up

यह विपणन डैशबोर्ड सामाजिक विज्ञापन खर्च से उत्पन्न होने वाले पसंद और संलग्नता पर केंद्रित है। शीर्ष खंड में एक निर्धारित समयावधि के दौरान प्रमुख सामाजिक प्लेटफार्मों पर कुल पसंद और संलग्नता को ट्रैक करता है। एक रेखा ग्राफ आपके विभिन्न विज्ञापनों में विज्ञापन खर्च का विवरण देता है जिसमें आपके सर्वाधिक प्रदर्शन के लिए खिंचने योग्य टिप्पणी होती है।

stars icon
Questions and answers
info icon

KPI dashboards with unique visualizations can significantly improve decision making in business by providing a clear and concise view of performance metrics. These dashboards allow for easy interpretation of complex data, enabling businesses to quickly identify trends, monitor progress towards goals, and make informed decisions. They also promote transparency and team alignment by ensuring everyone has access to the same information. Furthermore, they can boost morale by visually demonstrating progress and success.

To effectively align KPIs with business goals, you should first clearly define your business objectives. Once you have a clear understanding of what you want to achieve, you can then identify the key performance indicators that will help you measure your progress towards these goals. It's important to ensure that these KPIs are relevant and quantifiable. You should also make sure they are attainable within your current constraints to improve morale, transparency, and team alignment. Using KPI dashboards can also be helpful as they provide a visual representation of your progress, making it easier to make informed decisions.

View all questions
stars icon Ask follow up

दाहिने हाथ के डैशबोर्ड पर नंबर विज्ञापन खर्च और वापसी से संबंधित महत्वपूर्ण वित्तीय मापदंडों को उजागर करते हैं। शीर्ष बाएं में आपका कुल बजट है, नीचे खर्च की गई राशि है, और मध्य दाएं में आपकी उत्पन्न आय है।इस उदाहरण में, आय ने 62% की रॉय की ओर नेतृत्व किया (जो निचले बाएं कोने में है)। (स्लाइड 21)

सामाजिक मीडिया विपणन

कर्मचारी प्रदर्शन डैशबोर्ड

जबकि प्रबंधक और अधिकारी व्यावसायिक KPIs का पालन करते हैं, उन्हें व्यक्तिगत स्तर पर प्रदर्शन का भी पालन करने की आवश्यकता होती है। इस कर्मचारी प्रदर्शन डैशबोर्ड में, बाईं ओर कर्मचारी मूल्यांकन स्कोरबोर्ड का उपयोग बेंचमार्किंग के उद्देश्यों के लिए कर्मचारी प्रदर्शन को ग्रेड करने के लिए किया जा सकता है। मध्य में बार चार्ट का उपयोग कर्मचारी मूल्यांकन स्कोर को दृश्यमान करने के लिए किया जा सकता है।

stars icon Ask follow up

दाईं ओर एक और स्कोरबोर्ड अन्य स्कोरिंग क्षेत्रों का विवरण देता है जहां टीमों का मूल्यांकन कार्य की गुणवत्ता और मात्रा, कार्य क्षमता, या पहले संपर्क और समाप्ति के बीच अपने बिक्री चक्र अवधि को कम करने जैसे अधिक विशिष्ट कार्यों के आधार पर किया जाता है। दाईं या बाईं तीर सुधार में वृद्धि या सुधार में कमी को प्रदर्शित करते हैं। (स्लाइड 30)

stars icon Ask follow up
कर्मचारी प्रदर्शन अंक

लाभ

आपके लक्ष्यों के अनुरूप और आपकी वर्तमान सीमाओं के भीतर प्राप्य होने वाले, प्रासंगिक, मापनीय KPIs के साथ, आप मनोबल, पारदर्शिता, टीम समन्वय, और समग्र सफलता दर में सुधार कर सकते हैं। लक्ष्यों का निर्माण करें फिर उनका कार्यान्वयन मापें, मापनीय उद्देश्यों के आधार पर मजबूत निर्णय लें, और वास्तव में हर व्यावसायिक उपयोग के लिए अद्वितीय दृश्यमानताओं के साथ समझने में आसान KPI डैशबोर्ड्स के साथ अपने लक्ष्यों को प्राप्त करें।

stars icon Ask follow up
download Download this presentation

Get 10 out of 30 slides

Powerpoint Keynote
View all formats chevron_right

Download and customize this and hundreds of business presentation templates for free

Start for free ⬇️

Voila! You can now download this presentation

Download